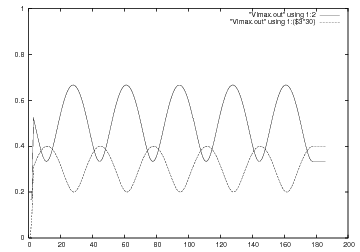
This web page consists of video clips that illustrate waves traveling on a transmission line. The simulation data was all collected using a program I wrote, TLINE.
TLINE uses the finite-difference time-domain (FD-TD) method to compute the voltage and current along a transmission line. The coupled, first order transmission line equations are solved using a marching-in-time algorithm.
The following video clips are for four different cases:
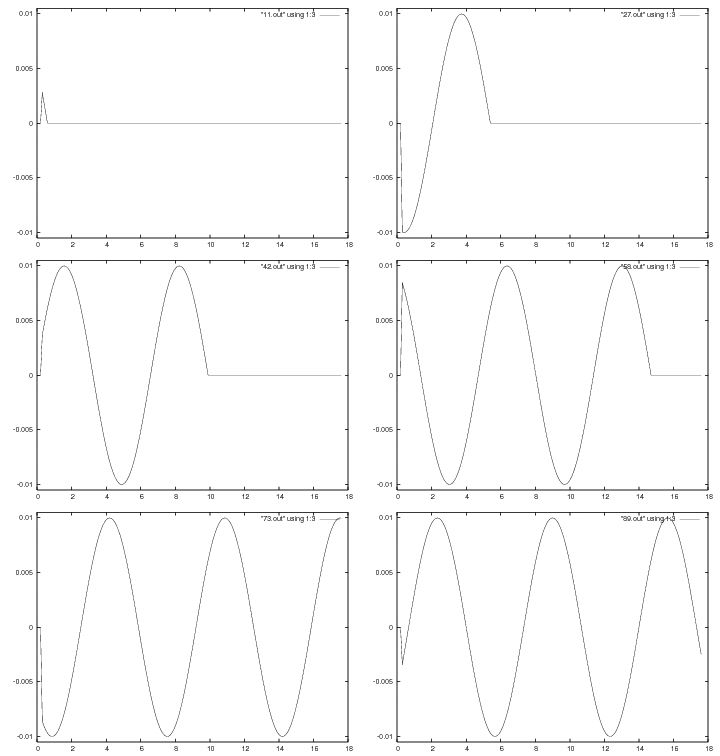
This clip is a gaussian pulse traveling down a 50 ohm line that is matched. Note how, because the load impedance is the same as the characteristic impedance, there is no reflection.
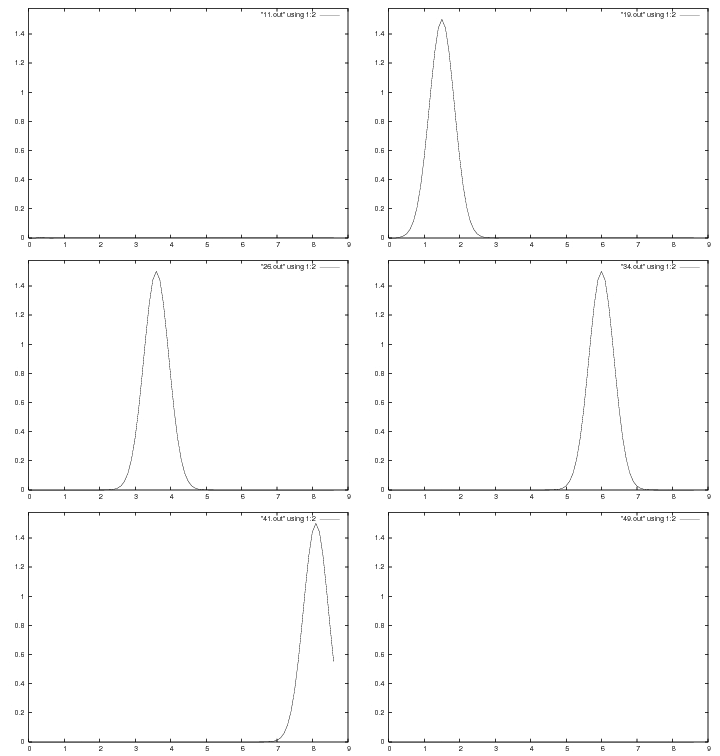
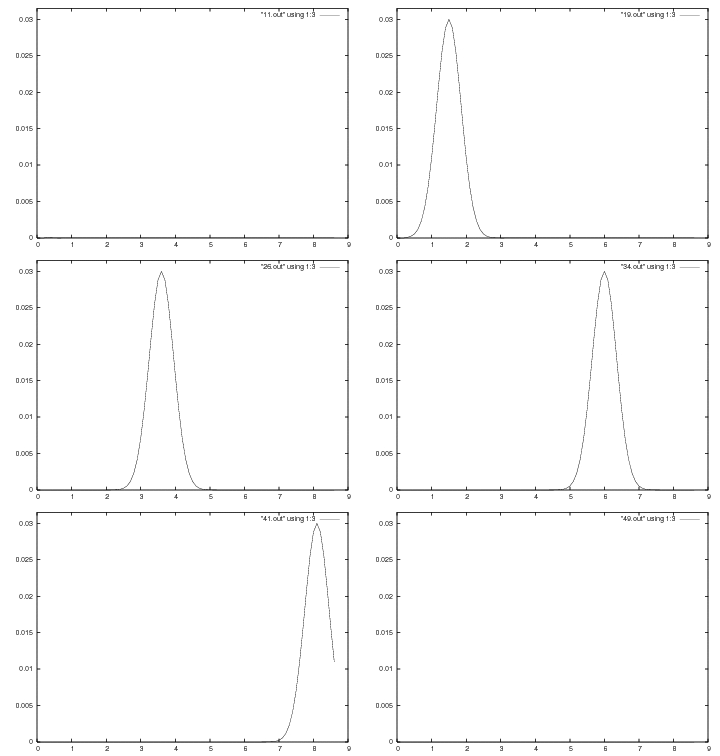
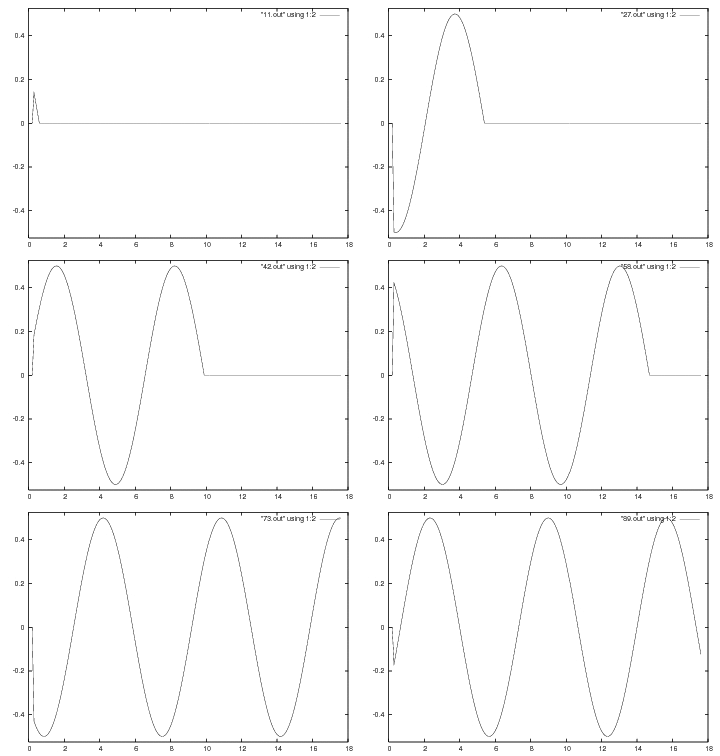
This clip is similar to the above. The wave is a sine curve traveling down a 50 ohm line that is matched. Again, because the load impedance is the same as the characteristic impedance, there is no reflection.
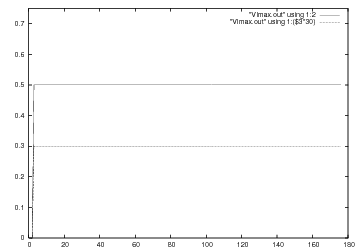
The "Max Values" graph shows the maximum value of voltage (solid line) along the transmission line; the dotted line is the maximum value of current along the line, multiplied by 30.
This graph may not be interesting; however, it is very important to note that the maximum value of voltage (0.5 V) and the minimum value of voltage (0.5 V) are the same, giving a standing wave ratio of 1.0.
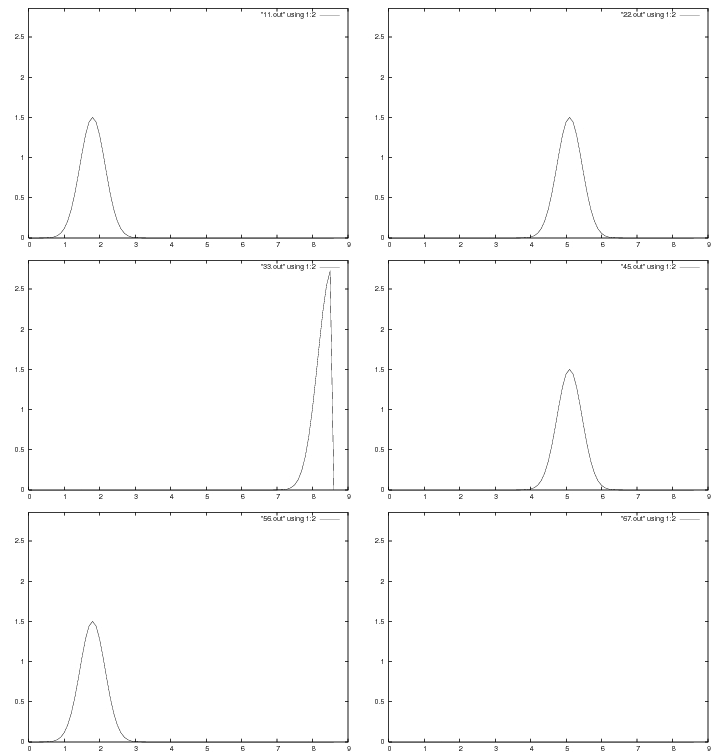
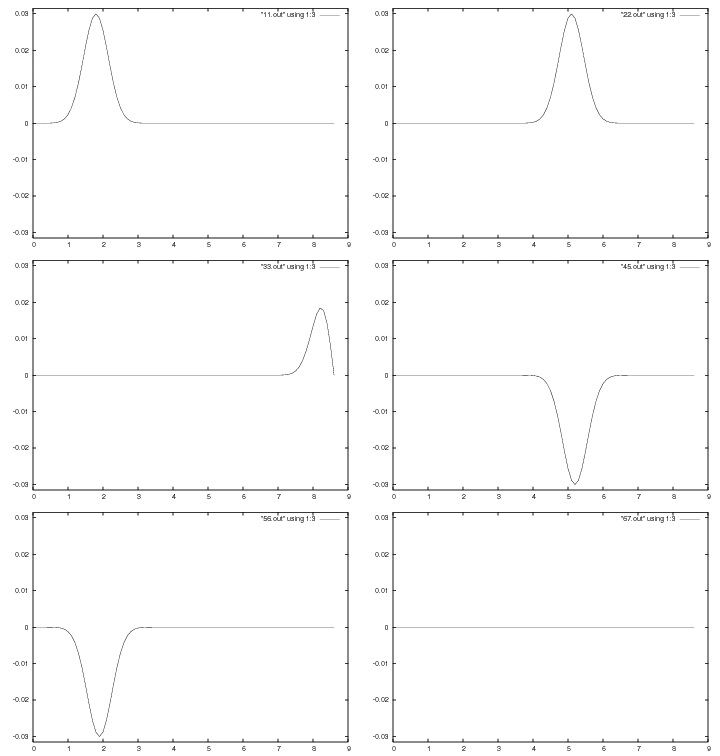
This clip is a gaussian pulse traveling down a 50 ohm line that is open circuited. Note how, because the load impedance is infinite, there is a large reflection. Also note that the voltage reflected is positive, but the current reflected is negative.
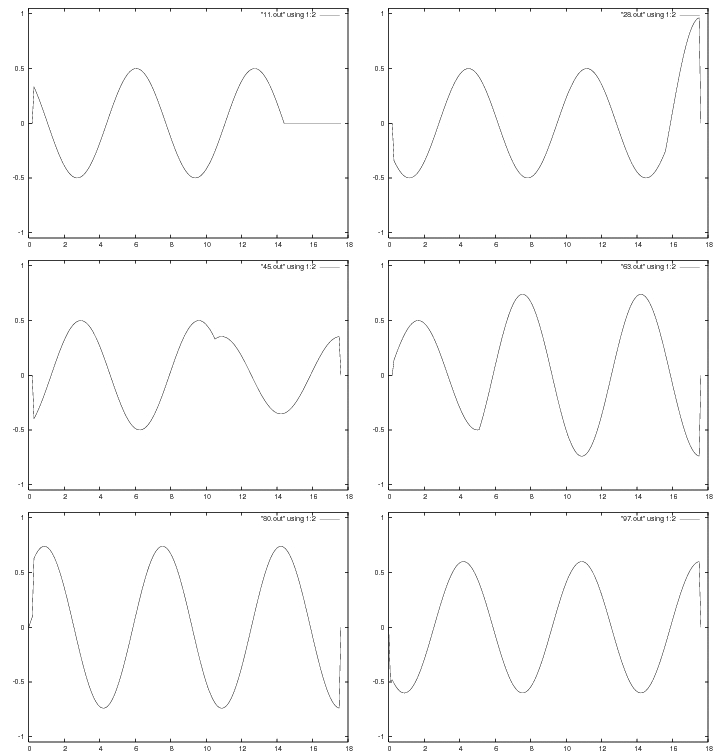
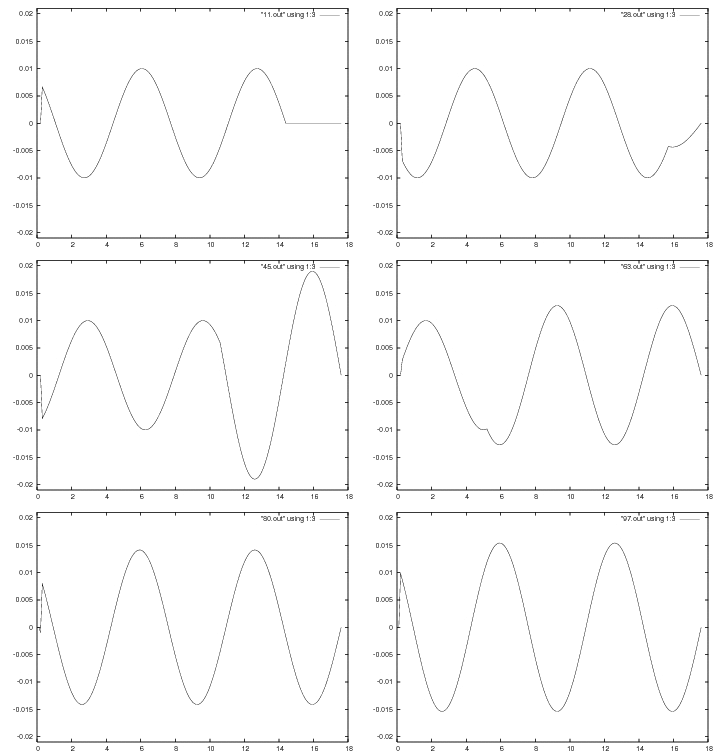
This clip is similar to the above. The wave is a sine curve traveling down a 50 ohm line that is open circuited. Note how, because the load impedance is infinite, there is a large reflection.
Look at the graph carefully, once the standing wave has developed. Notice how there is no movement to the left or right, the wave appears to be standing. This implies that there is no power delivered.
You may have noticed that the short circuit load condition is not shown here. This is because the short circuit load would give very similar results, where the current behaves like the voltage graph, and the voltage behaves similar to the current graph.
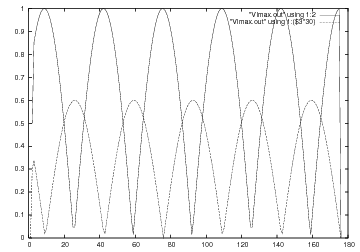
The "Max Values" graph shows the maximum value of voltage (solid line) along the transmission line; the dotted line is the maximum value of current along the line, multiplied by 30.
This graph is a bit more interesting. The maximum value of voltage (1 V) and the minimum value of voltage (0 V) gives an infinite standing wave ratio.
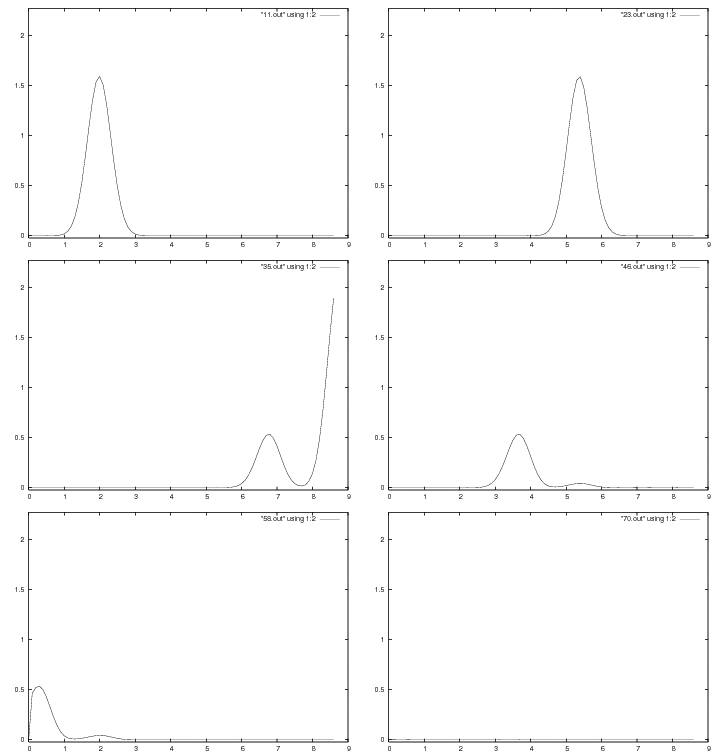
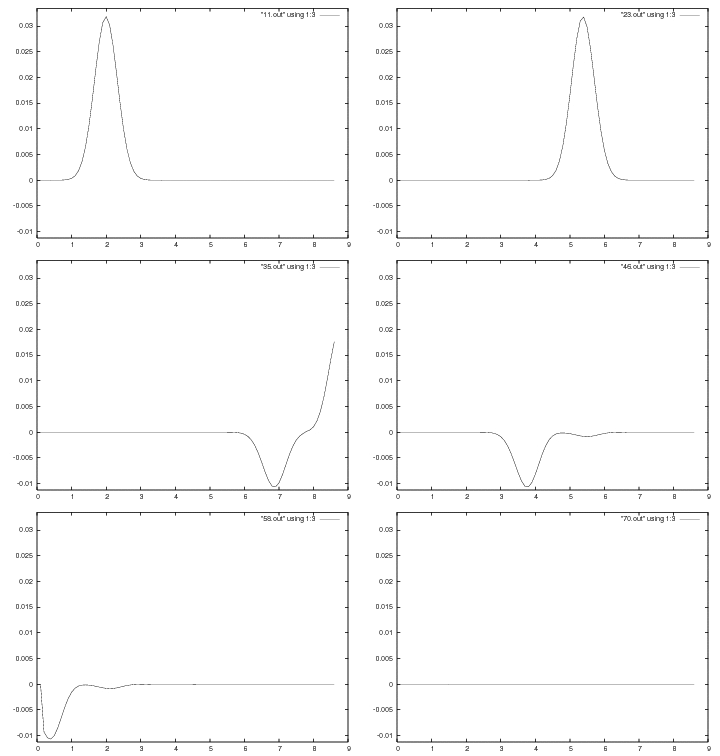
This clip is a gaussian pulse traveling down a 50 ohm line that has load impedance larger than the line impedance. There is a reflection, but it is smaller than the incident pulse. This is because some of the power has been absorbed by the load.
The small tail at the end of the reflected gaussian pulses is not physical; the blip is an artifact of dispersion in the FD-TD method.
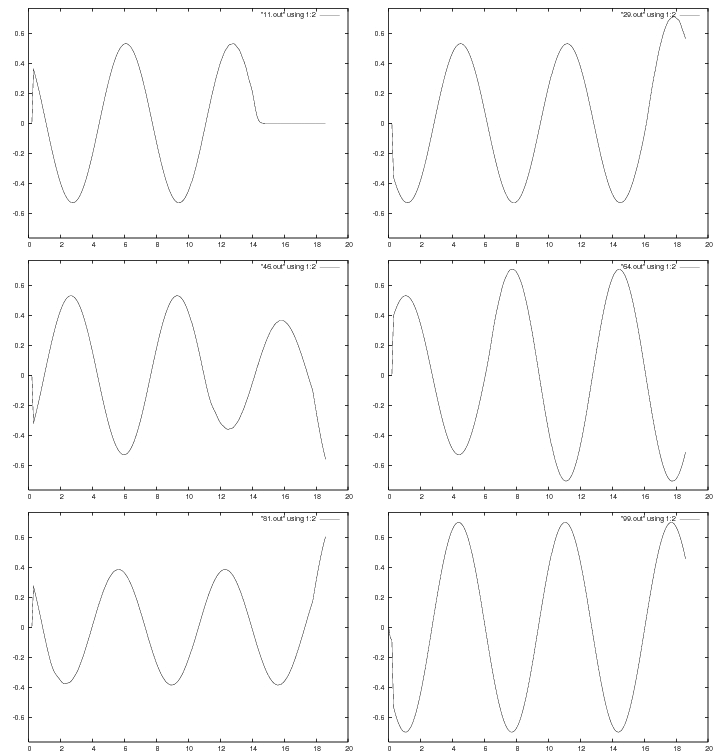
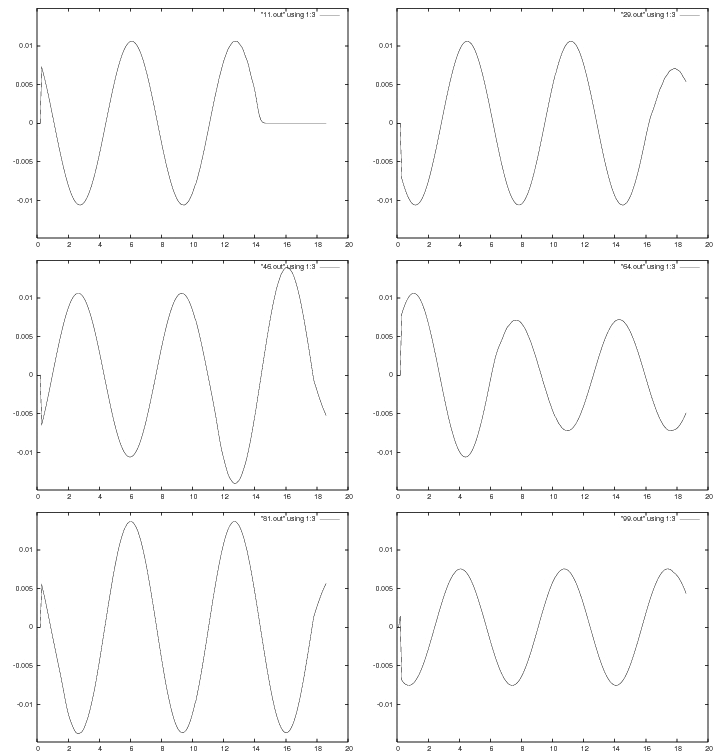
This clip is similar to the above. The wave is a sine curve traveling down a 50 ohm line that has a load impedance larger than the line impedance. There is a reflection, but, because the reflected wave is smaller, the wave is not purely "standing" but has some movement toward the load.
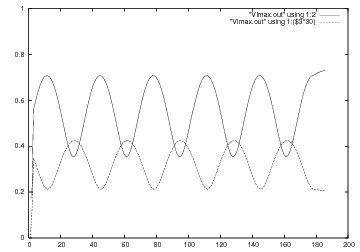
The "Max Values" graph shows the maximum value of voltage (solid line) along the transmission line; the dotted line is the maximum value of current along the line, multiplied by 30.
This graph is a bit more interesting. The maximum value of voltage (0.7 V) and the minimum value of voltage (0.35 V) give a standing wave ratio of 2.0.
This clip is a gaussian pulse traveling down a 50 ohm line that has a line impedance that is larger than the load impedance. The results are similar to the RoGP case. The reflected voltage, however, is negative, and the reflected current is positive. Also, there is much less dispersion in this case.
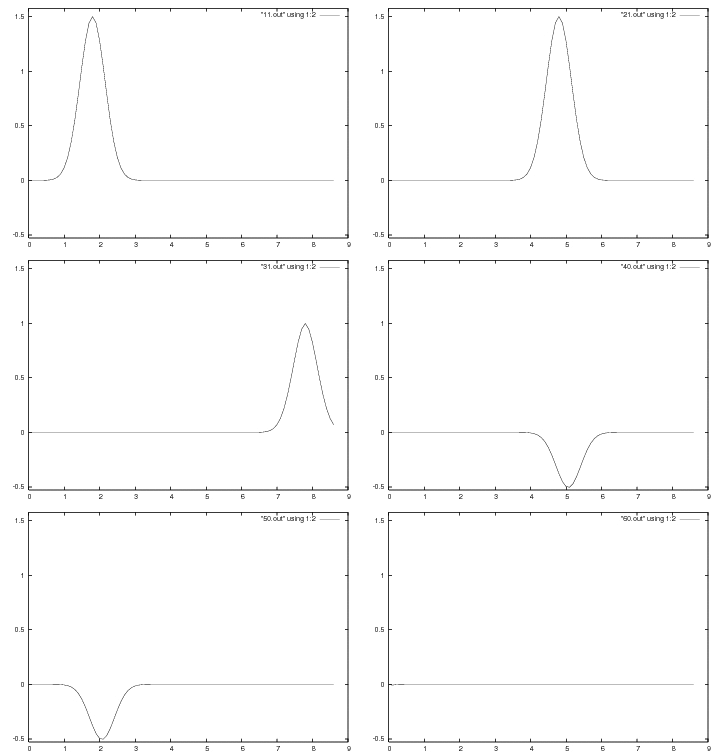
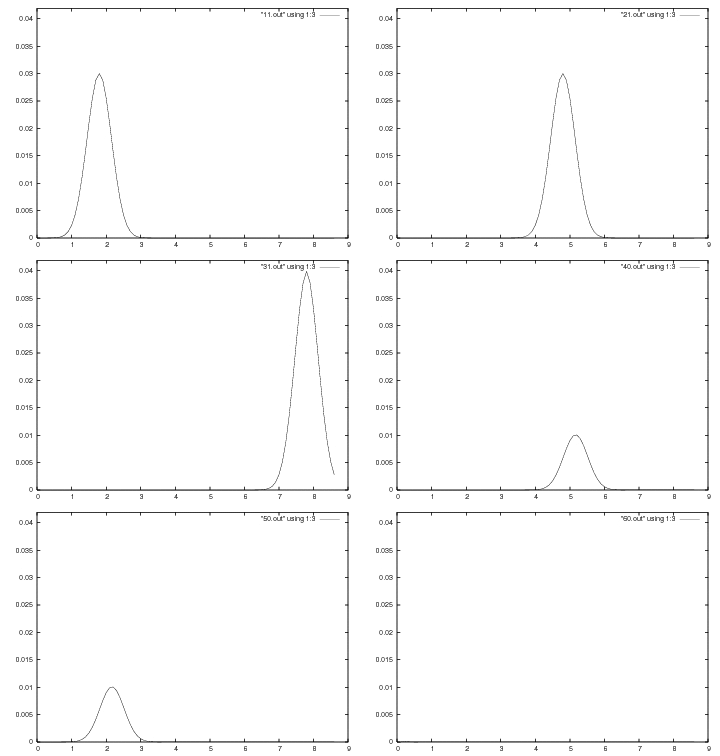
This clip is similar to the above. The wave is a sine curve traveling down a 50 ohm line that has a line impedance that is larger than the load impedance.
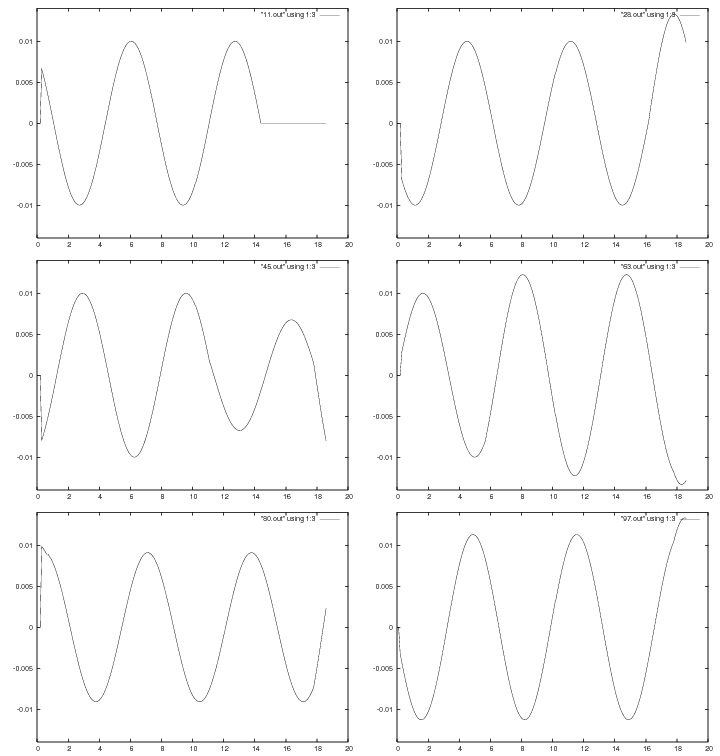
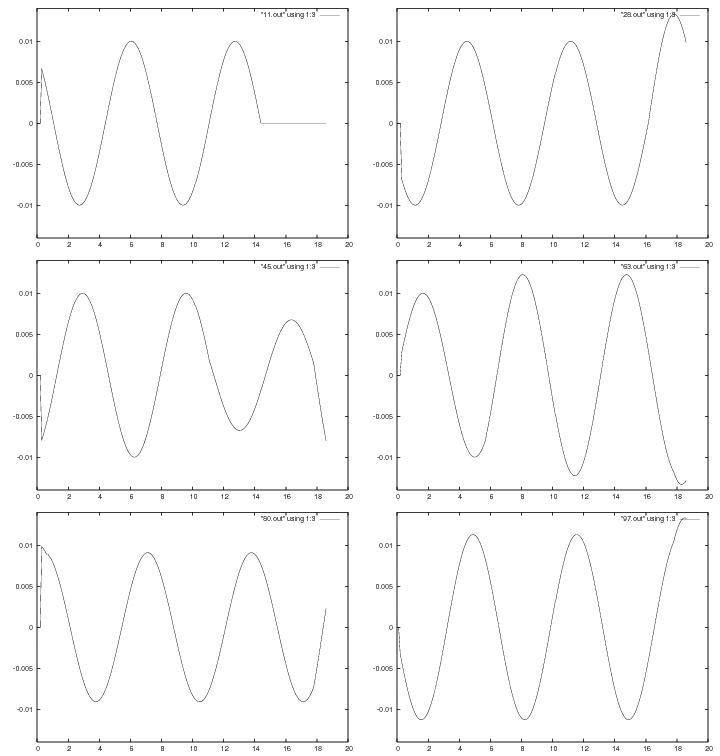
The "Max Values" graph shows the maximum value of voltage (solid line) along the transmission line; the dotted line is the maximum value of current along the line, multiplied by 30.
This graph is a bit more interesting. The maximum value of voltage (0.7 V) and the minimum value of voltage (0.35 V) give a standing wave ratio of 2.0.
